
#48 – Learning Centers in Laundromats. Innovative Ideas in Education + One Tweak
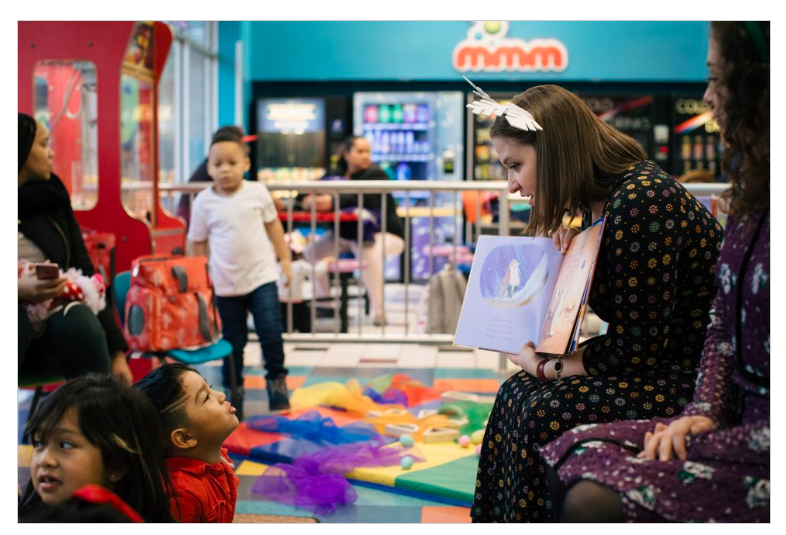
Chicago Public Library staff librarian Megan McFarlane travel interacting with children during Laundromat Story Time, a program that combines early education principles with public outreach. (ALYSSA SCHUKAR FOR USN&WR)
There’s an interesting educational initiative underway in Chicago — specifically in laundromats across the city.
With support from Chelsea Clinton’s Too Small to Fail initiative, the city’s public library system has set up learning centers in laundromats around the city. The goal is to provide under-resourced children with the opportunity to learn while their parents are washing clothes.
And Chicago’s not alone. In Minnesota, the State Fair is adding math to the more standard fair offerings of rides and funnel cake. They’re calling it “Math On-A-Stick”, with geometric tiles to create patterns and opportunities to sort colored eggs. (Corn dogs not included.)
These innovative ideas in education were part of the conversation at the Erikson Institute’s Promising Math conference we attended back in November 2019 — and part of a wave of out-of-the-box strategies we’re seeing that aim to give kids more opportunities to learn.
These non-traditional efforts are admirable and intriguing. What if the simple act of putting learning centers in laundromats could help change the statistics that show only 1 in 4 children in the state of Illinois show up to kindergarten with adequate math, reading and social-emotional skills? What if incorporating math into the State Fair could help close Minnesota’s education achievement gap, which, by some estimations, is the worst in the entire country?
There’s just one question: While we’re swimming in data about the problems, where’s the data on our efforts to solve them?
One potential tweak we’d offer is to focus on the right performance metrics to identify wins and struggles and to create a roadmap for other communities. Without tracking performance metrics, it’s hard to tell what’s working and what’s not, and when you need to adjust your approach.
We’ve seen that firsthand in the family empowerment project we’ve piloted at two schools in Charlotte, N.C. As part of the project, we created a collaboration between a local district school and its neighboring charter to build higher-levels of family engagement and involvement and, by extension, student performance. We know the statistics we have to combat, and we’re measuring our progress toward those goals at every step of the process.
It’s not about collecting data for the sake of justifying our existence. (Luckily for us, our lead supporter on the project — Kristi Thomas of the Wells Fargo Foundation — champions data monitoring that pushes the project forward, rather than tracking metrics that prove a return on investment.) Instead, it’s about measuring the impact of what we’re doing so we can determine whether it’s working, for the scholars, families, and educators we serve.
The use and applicability of data within all levels of public education can be a slippery slope. No data tracking and kids are just running around talking about feelings all day. Too much emphasis on data and student’s imaginations are limited to the 19th century standardized tests they’ll be subjected to at the end of the year.
One of the questions we were asked most often at the Erikson conference was around data — what to collect and how to collect it. The answer, in short, is that data should be baked into every stage of any innovative pursuit. You need to analyze the statistics you’re working to change before you implement a program. You need to measure your impact as your project is underway so you can identify opportunities to pivot. And you need to conduct a thorough review when your project comes to an end to get a complete picture of how effective your efforts were in solving the problems you set out to tackle.
Perhaps the most important: You need to use that data to co-create with those you seek to serve so you can reach the end goal. Stay proximate to the change you seek.
In our family empowerment project, we began our work with a deep dive within a specific focus area, in collaboration with a district and charter school serving approximately 900+ families. We reviewed 500+ pre-surveys from families to understand their current needs and desires. Because of those surveys and the consistent communication cycle with families and school staff, we’ve adjusted our programming to give families more of what they want and less of what they don’t. Each school is now averaging approximately 45 families and 150 attendees at each family night. Such high levels of attendance are also leading to a stronger sense of community among our families. Soon, we’ll be able to leverage district-wide metrics that will show us how these efforts have affected student attendance levels in relation to family engagement and empowerment.
That’s when we’ll know if these collective efforts are truly making an impact. And that’s why data has to lie at the heart of everything we do to co-create solutions with students, families, and communities.
There shouldn’t be a failure to launch a new idea due to overthinking as it relates to data. Not every aspect of every project can or should be measured. However, those that can and do have powerful outcomes may have the ability to scale and truly transform public education.
But the only way to know is to measure it.
Leave a Reply
Want to join the discussion?Feel free to contribute!